Empowering 8M Indians to navigate the COVID19 pandemic
Empowering 8M Indians to navigate the COVID19 pandemic
Empowering 8M Indians to navigate the COVID19 pandemic
Empowering 8M Indians to navigate the COVID19 pandemic
2020 - 2021
2020 - 2021
2020 - 2021
2020 - 2021
Overview
India’s first unofficial mobile-first dashboard app to monitor COVID-19 spread at the village level, integrated with news updates to help people make well-informed decisions—a platform for hiring blue-collar workers and a grocery delivery service in selected cities of Goa.
Role
:
Founding Member
Client
:
CoronaTracker
Website
:
https://coronatracker.in/
Timeline
:
2 years
Problem Statement
In February 2020, when we kicked off CoronaTracker at the BITS Goa Hackathon, India had just reported 3 confirmed COVID-19 cases. There was no dashboard like John Hopkins University's for specifically tailored for India. So, we set out to create a simple, user-friendly, mobile-first dashboard to monitor the real-time spread of COVID-19 and spread information on precautionary measures to curb the virus.
During the second wave, there was a critical shortage of hospital beds, medicines and oxygen cylinders. People were pleading for help on social media. We saw the need for a volunteer network to connect resources with those in need. In some small towns, getting groceries was tough, so we extended the network to deliver essentials.
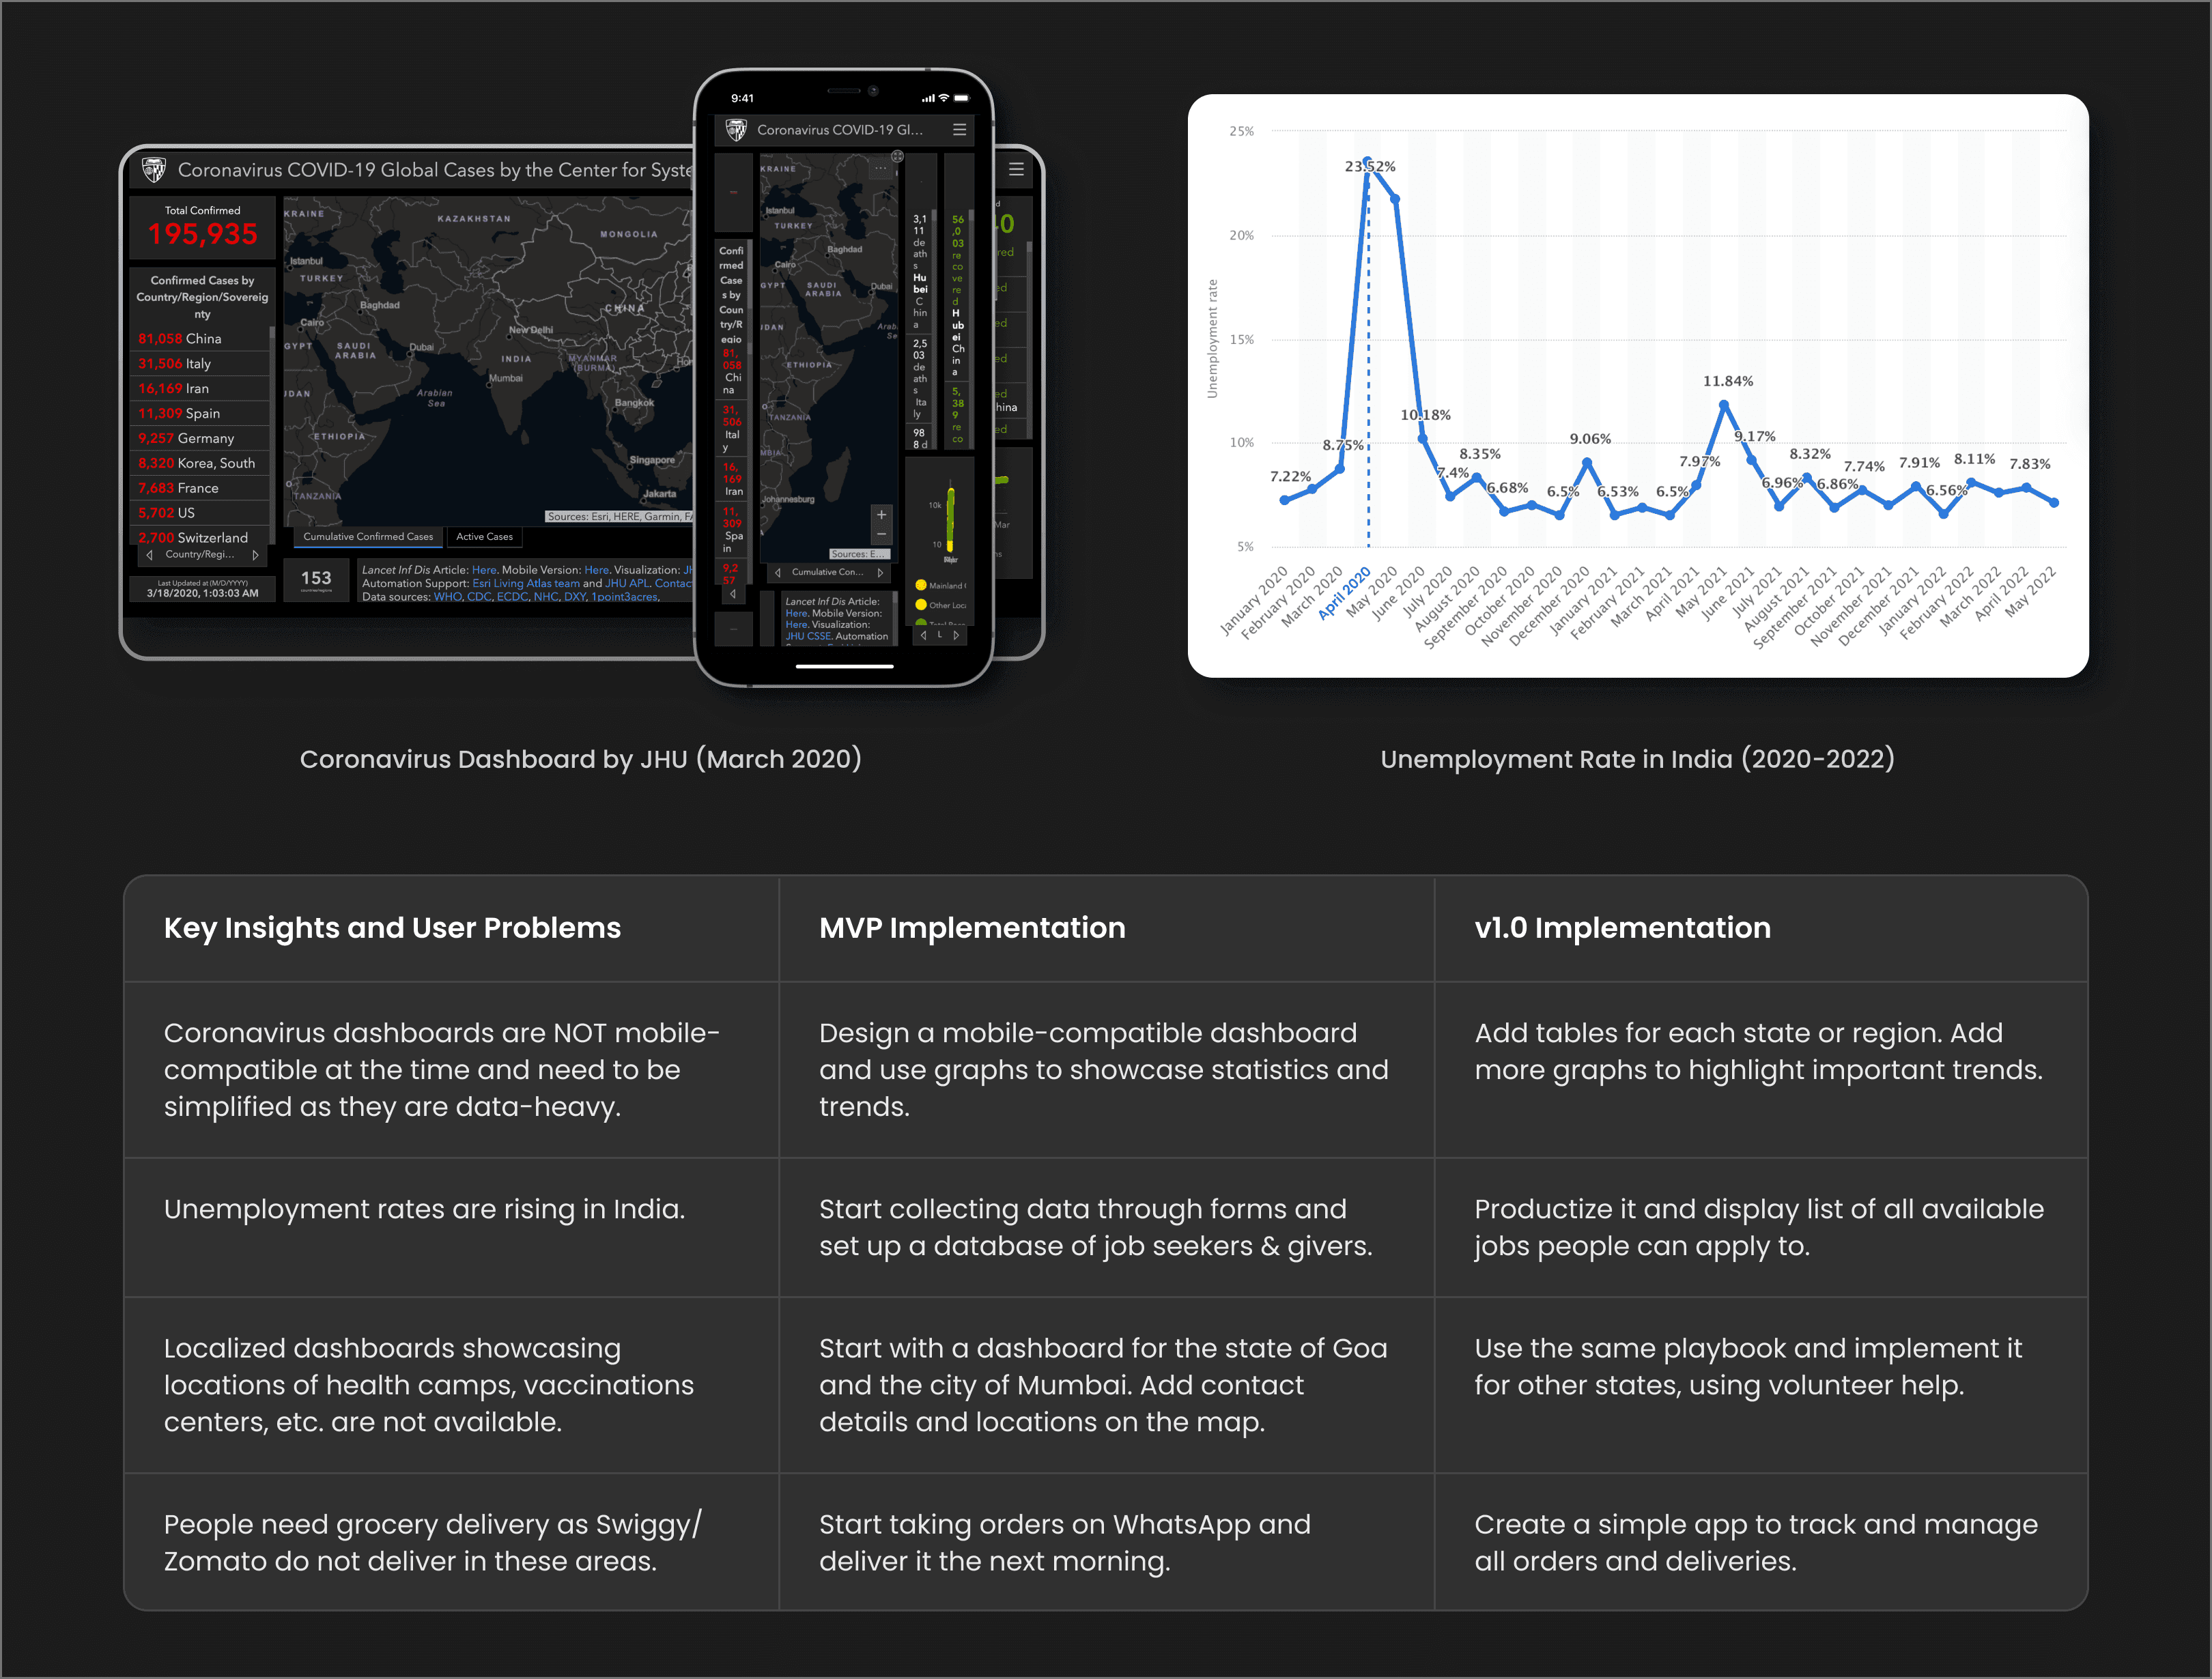
Lockdowns caused a mass movement of workers, and unemployment in India hit 23%. Blue-collar workers needed jobs. That's why we decided to create a platform to help them find work, teaming up with other hiring companies.
In February 2020, when we kicked off CoronaTracker at the BITS Goa Hackathon, India had just reported 3 confirmed COVID-19 cases. There was no dashboard like John Hopkins University's for specifically tailored for India. So, we set out to create a simple, user-friendly, mobile-first dashboard to monitor the real-time spread of COVID-19 and spread information on precautionary measures to curb the virus.
During the second wave, there was a critical shortage of hospital beds, medicines and oxygen cylinders. People were pleading for help on social media. We saw the need for a volunteer network to connect resources with those in need. In some small towns, getting groceries was tough, so we extended the network to deliver essentials.
Lockdowns caused a mass movement of workers, and unemployment in India hit 23%. Blue-collar workers needed jobs. That's why we decided to create a platform to help them find work, teaming up with other hiring companies.
User and Market Research
The initial COVID-19 data dashboard from John Hopkins University lacked an optimal mobile user experience, with an overwhelming amount of data that made information consumption challenging due to the absence of graphs and tables.
Amidst the pandemic, unemployment rates soared in India, especially affecting blue-collar workers who lacked easily accessible websites or platforms to apply for jobs.
The absence of localized dashboards hindered users from gaining insights into the impact on their districts and finding essential locations like health camps, police stations, hospitals, vaccination centers, etc. Additionally, people were keen to understand their proximity to recently confirmed active cases.
In states like Goa, heavily affected by COVID with prolonged lockdowns, popular grocery delivery apps such as Swiggy and Zomato were inadequately available, posing challenges for residents in accessing daily groceries.
With a severe shortage of hospital beds, medicines, and essential facilities, individuals turned to social media for assistance. Establishing a volunteer-driven network became essential to connect people with verified leads swiftly in times of urgent need.
Ideation and Journey
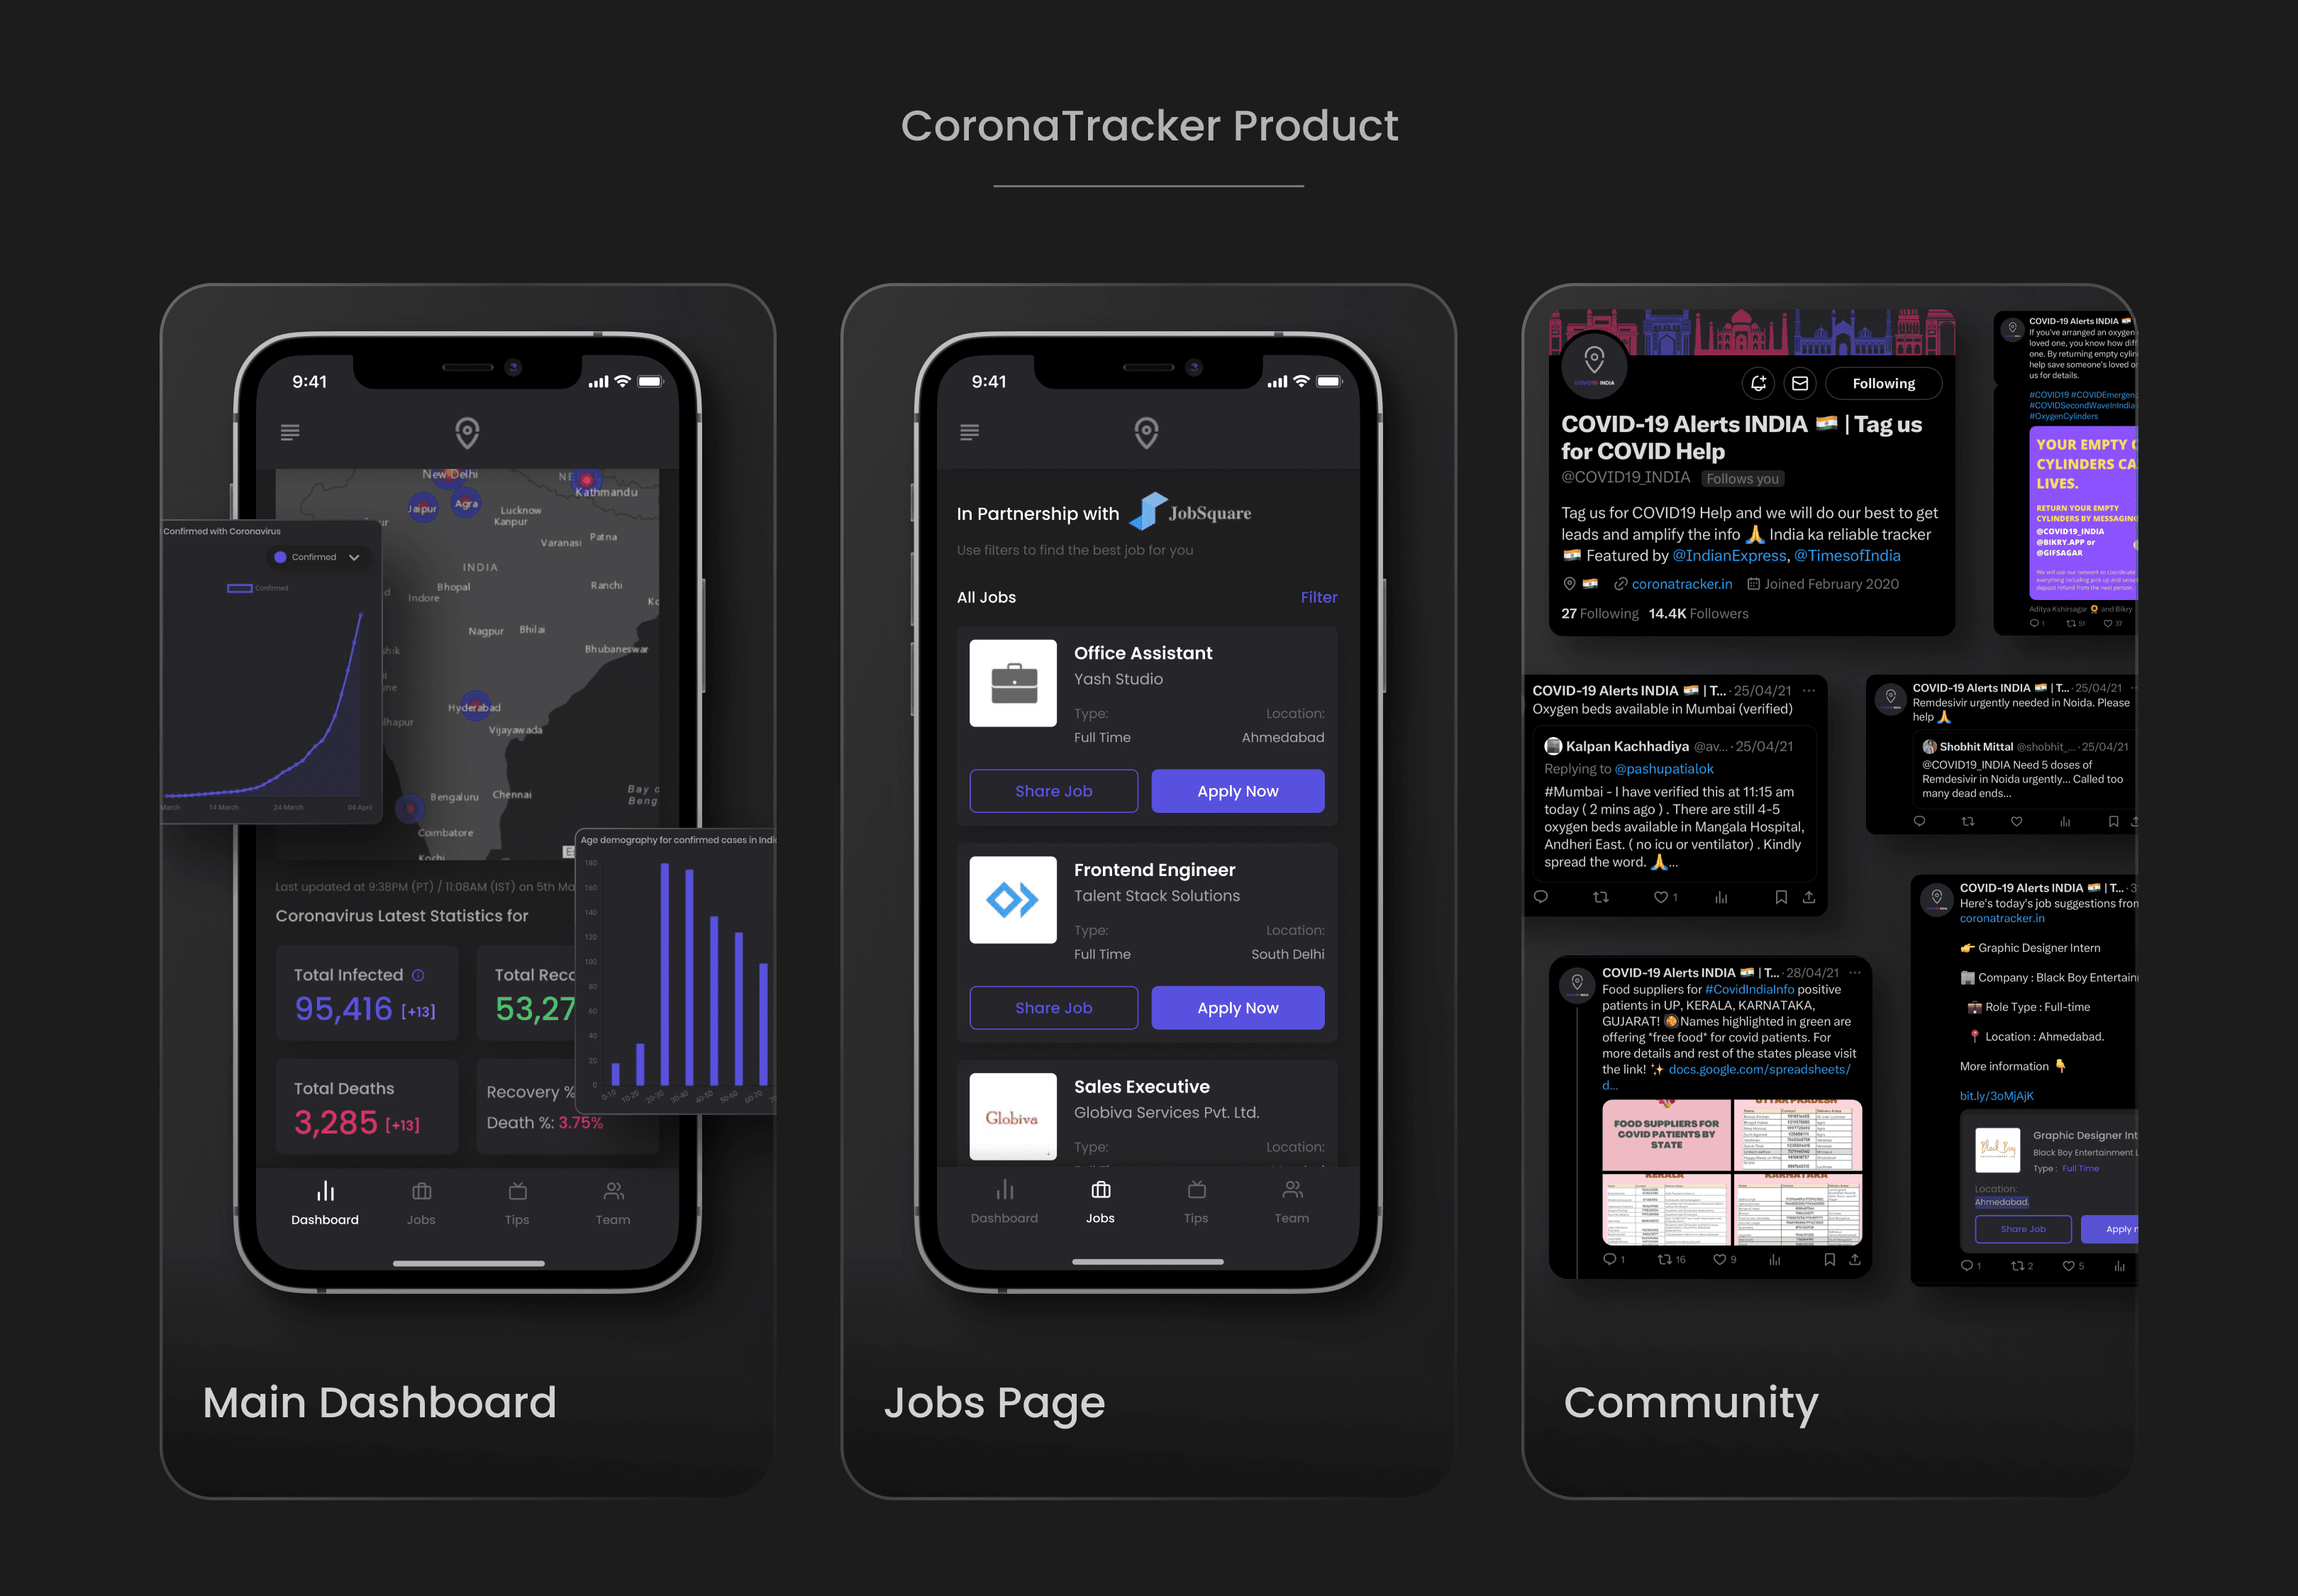
In February 2020, during the 'Hack by the Beach' hackathon organized by Devfolio and BITS Goa, we built a dashboard featuring a world heat-map showcasing COVID-19 spread. This map illustrated the severity of COVID-19 impact in various Indian regions, aiming to educate and raise awareness for pandemic preparedness. Alongside safety tips from the World Health Organization, we incorporated a line graph illustrating the actual virus spread versus the predicted rate. The project details can be found at https://devfolio.co/projects/corona.
Recognizing an initial lack of concern among the public, we expanded the dashboard's educational content. We spotlighted key statistics, including active cases, deaths, and recoveries, emphasizing recovery and death rates.In the subsequent weeks, as we received more India-centric data from the Ministry of Health and Family Welfare, India (MoHFW), we introduced an option to toggle between global and India-specific data. This feature seamlessly integrated global data from JHU and India-specific data from MoHFW. To provide a more detailed perspective, we included a table displaying the state-wise distribution of cases.
We were the first unofficial tracker in India, preceding covid19india.org. In March 2020, we started getting lots of traffic on our website. We even got many feature requests and feedback from our users. We enhanced our server capabilities and implemented audience tracking through Google Analytics. Recognizing the predominant mobile user base, we consistently optimized the mobile user experience of the app.
In April 2020, facing financial constraints as the sole employed member of the team, working as an Intern at Juno Finance, we introduced a donation option to generate funds. Participating in hackathons like Coronathon, we secured grants from companies such as PromoteHour to support essential services like website hosting, maps, and other paid functionalities. On the technological front, we explored alternatives like openstreetmap.org for better maps, moving away from ArcGIS. The funds not allocated to technical enhancements were set aside for our emergency fund.
To enhance public awareness, we initiated various campaigns and designed posters. Engaging in webinars and creating communities on WhatsApp and Telegram to share verified COVID-19 stats and news, we later transitioned to Twitter and garnered a following of over 15k. Our primary goal was to counteract misinformation and provide accurate and verified news.

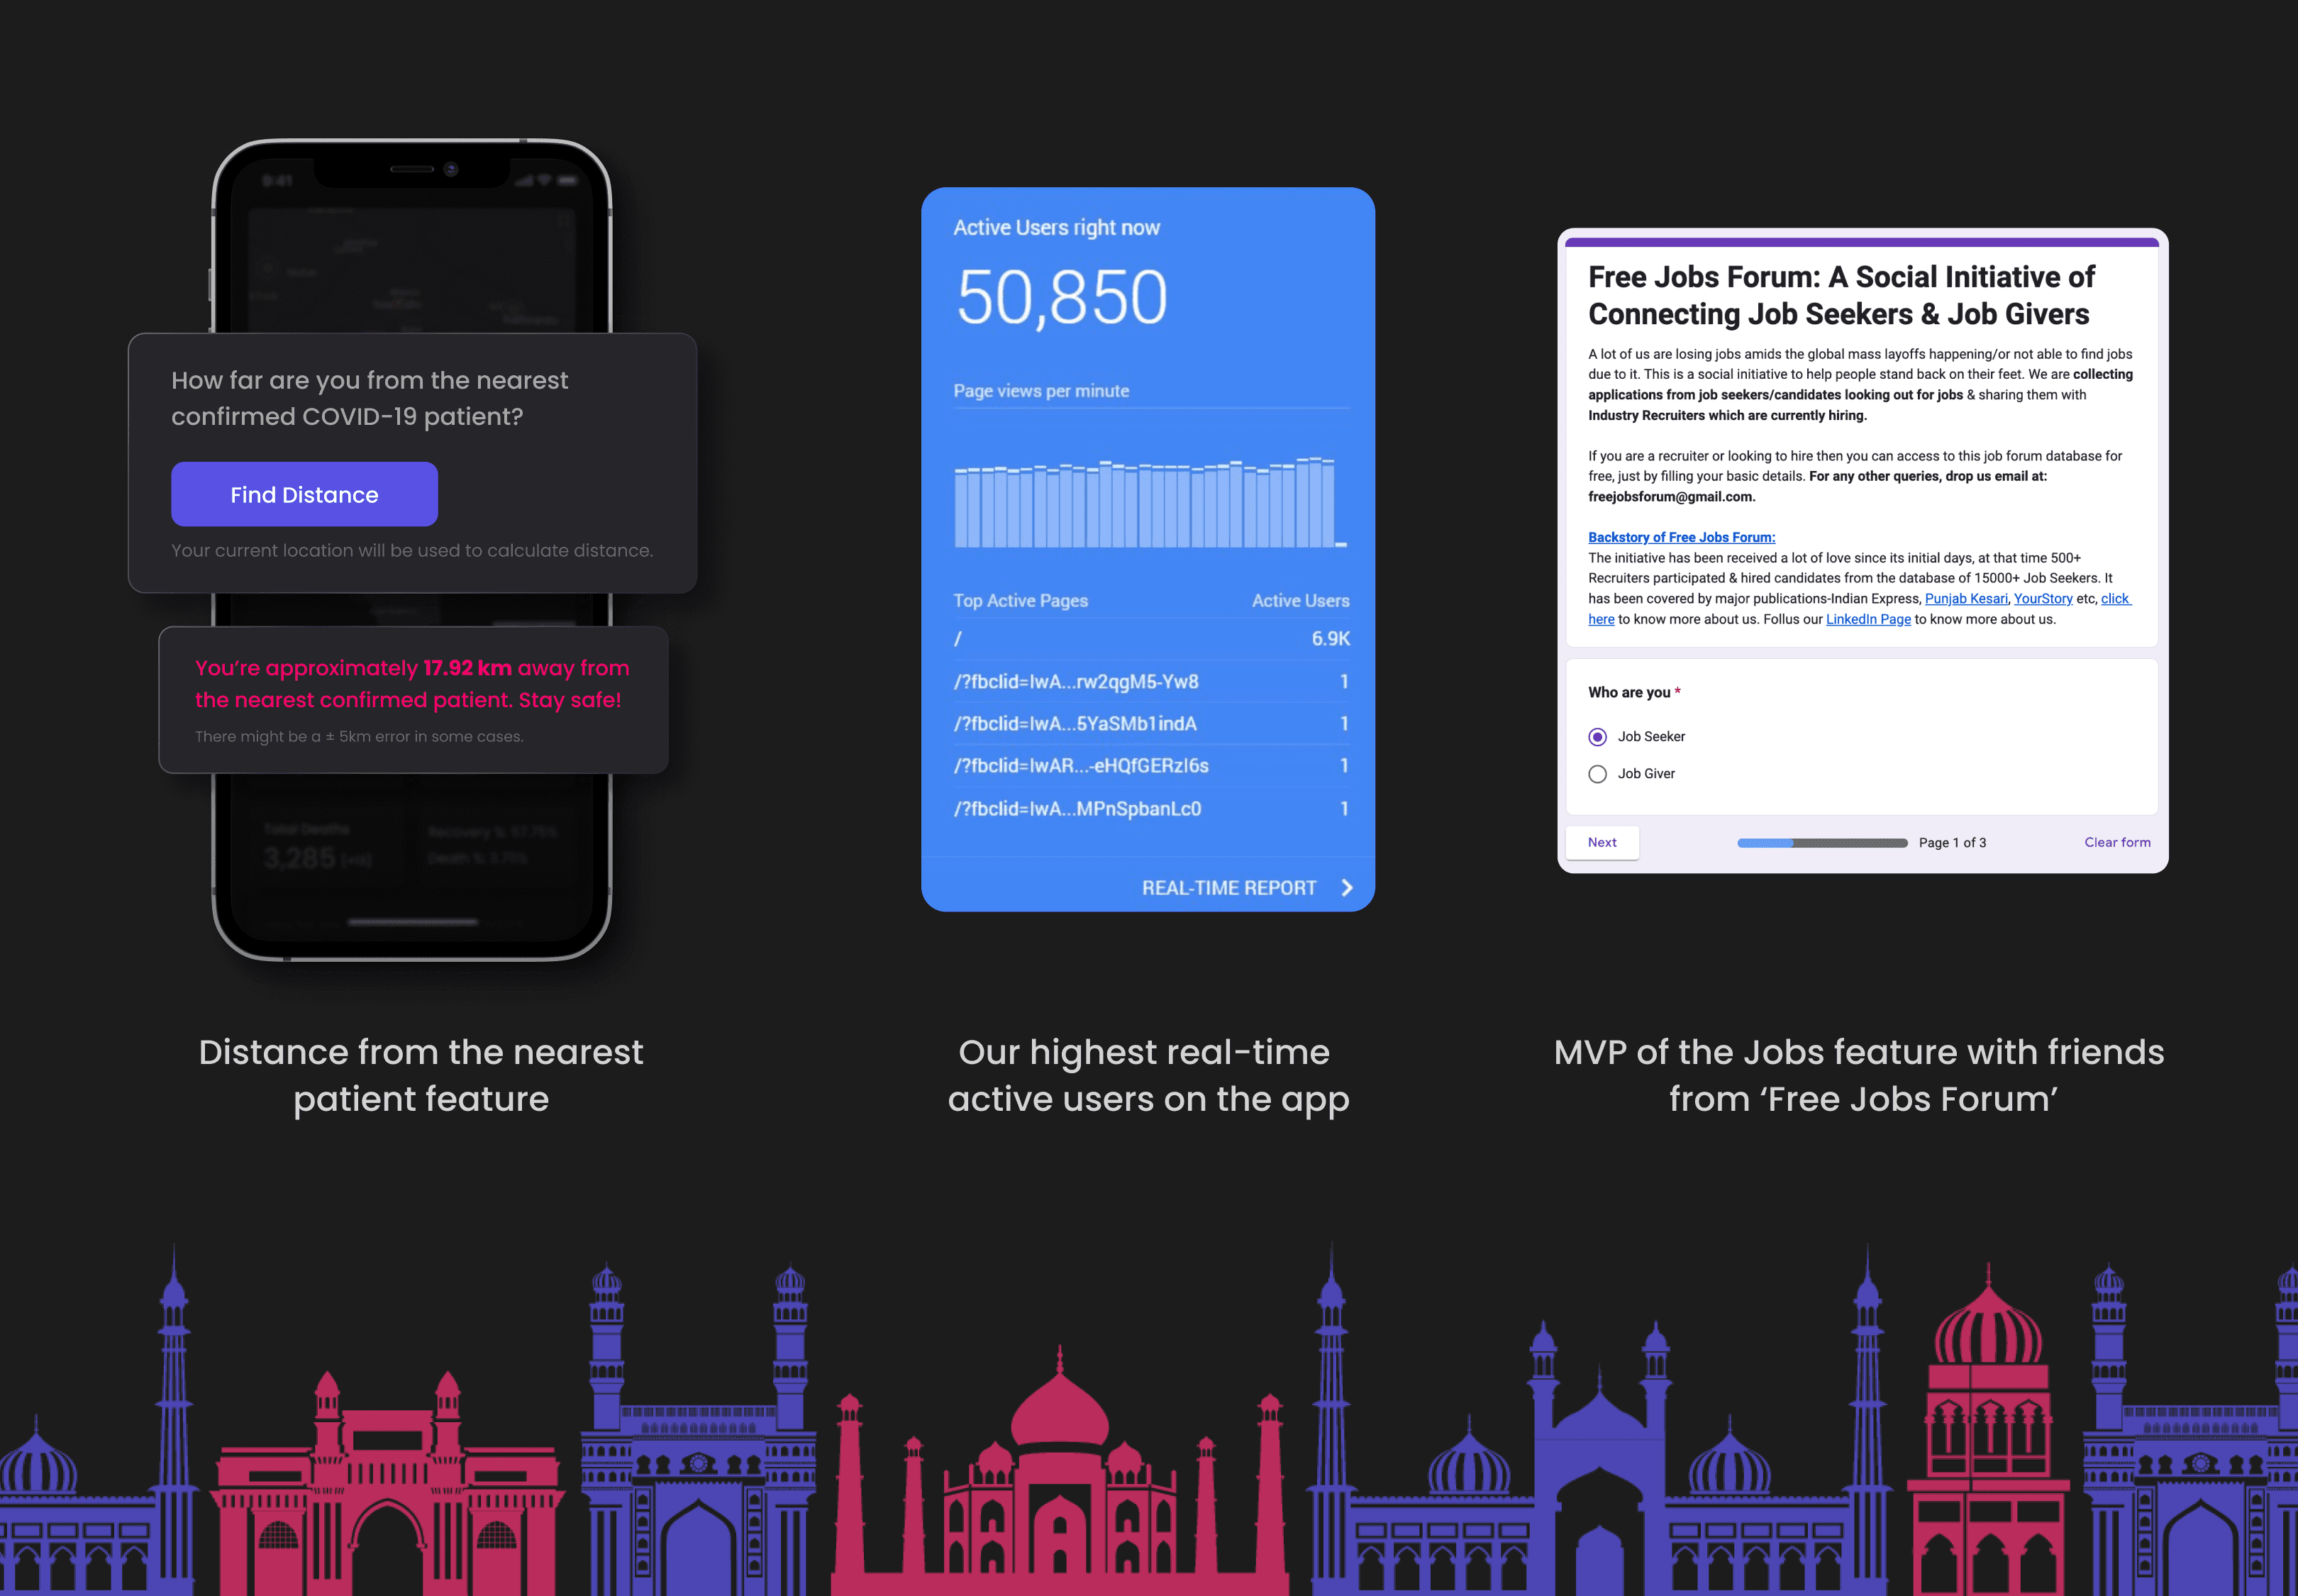
Responding to a common user request, we introduced a distance tracker feature to determine the proximity to the nearest detected case. This feature gained widespread popularity and resulted in media coverage, expanding our outreach significantly. In September 2020, we achieved a remarkable milestone with an all-time high of 632k daily users and 50,850 real-time active users.
By November 2020, as the first wave of COVID-19 was receding, there was a surge in unemployment across India. A significant portion of the working class had relocated from tier-1 cities to their hometowns. While some adapted to remote work, there remained a 23% unemployment rate. To address this, we collaborated with individuals on Twitter curating a datasheet of people looking out for jobs. Utilizing a Google form, we facilitated data collection by encouraging our users to share their job status and preferences.
Encouraged by the positive response, we recognized the opportunity to productive the idea. Teaming up with JobSquare, we integrated a dedicated page on our dashboard for job openings, particularly catering to blue-collar workers. With over 500 listed job opportunities, users could easily filter and find suitable positions. This collaboration not only increased JobSquare's user base by 5-10%, driven by CoronaTracker, but also helped numerous individuals secure employment.
There were several dashboards and products for India, like the covid19india.org, led by MedTech startup leaders in Bangalore with a volunteer base of 300+, as the most-used dashboard for tracking COVID-19 stats in India. Rather than competing for the top spot, we chose to address niche problems. Consequently, we developed a localized solution, introducing additional state dashboards for Goa and Mumbai. These new features included maps highlighting Vaccine Centers, Hospitals, Testing Centers, Isolation Centers, etc. Our mentor Aditya Kshirsagar, reached out to government officials from the Bombay Municipal Council, obtaining more data to establish a highly-focused dashboard for Mumbai city.
We were featured on Prudent Media News, a prominent Goan news channel, through a video interview. This collaboration not only strengthened our relationship with Prudent Media but also facilitated quicker access to data for the state of Goa.
Throughout the second wave in India, from March 2021 to May 2021, there was a critical shortage of essential medical supplies such as Remdesivir, FabiFlu, ICU beds, blood plasma, and oxygen cylinders. Numerous posts sought help and shared resources on Twitter. Leveraging our Twitter account distribution, we played a pivotal role in connecting those in need with verified resources and contacts for COVID-19. To manage the overwhelming volume of requests, we got volunteers, dealing with up to 300-400 direct messages daily, in addition to numerous mentions on Twitter.
With most of our team based in Panjim, where grocery delivery services were limited, we initiated a local grocery delivery service in and around the city. The CoronaTracker team developed a simple mobile app for ordering daily essentials, ensuring next-morning delivery. Simultaneously, we enhanced our primary product by incorporating data from improved APIs in India.
Our involvement with CoronaTracker led us to discover like-minded individuals across India with a shared mission during the pandemic. Collaborating and volunteering with organizations such as endcoronavirus.org, Outbreak Control Room, Covid Alert Tracker, Goa COVID Emergency, Covid Relief India Alliance, COVID India Central, and The Product Folks, our team actively contributed to various initiatives. I also assisted multiple organizations in designing products for the general public and those meant for government officials.
Final Prototype
Our live website, accessible at https://coronatracker.in, features a dashboard with the latest data as of October 2021. It also provides an insightful overview of our team's entire journey and highlights our media coverage from various news outlets.
Our live website, accessible at https://coronatracker.in, features a dashboard with the latest data as of October 2021. It also provides an insightful overview of our team's entire journey and highlights our media coverage from various news outlets.
Our live website, accessible at https://coronatracker.in, features a dashboard with the latest data as of October 2021. It also provides an insightful overview of our team's entire journey and highlights our media coverage from various news outlets.
Our live website, accessible at https://coronatracker.in, features a dashboard with the latest data as of October 2021. It also provides an insightful overview of our team's entire journey and highlights our media coverage from various news outlets.
Implementation
While working on this app, our team had an average age of about 21 years. We sought guidance from mentors, particularly Aditya Kshirsagar and Raj Kunkolienkar.
In terms of roles:
For Product & Design, I, Niket, took the lead.
The tech responsibilities were divided among Shrey, Hrishikesh, Sanket, Salil, and Nishant.
Almost everyone played a part in contributing to growth, marketing, and volunteer efforts through our Twitter to assist people with resources.
To respond to messages on our Twitter account, we got around 8-10 volunteers to help.
Result and Impact
For the full stats and media coverage links, please visit the official website of the CoronaTracker, https://coronatracker.in.
These were some of our breakthrough stats:
Featured by NITI Aayog, Indian Express, Republic TV, and 20+ press releases by national and state-level news media.
Recognized and felicitated by the Chief Minister of Goa, Dr. Pramod Sawant.
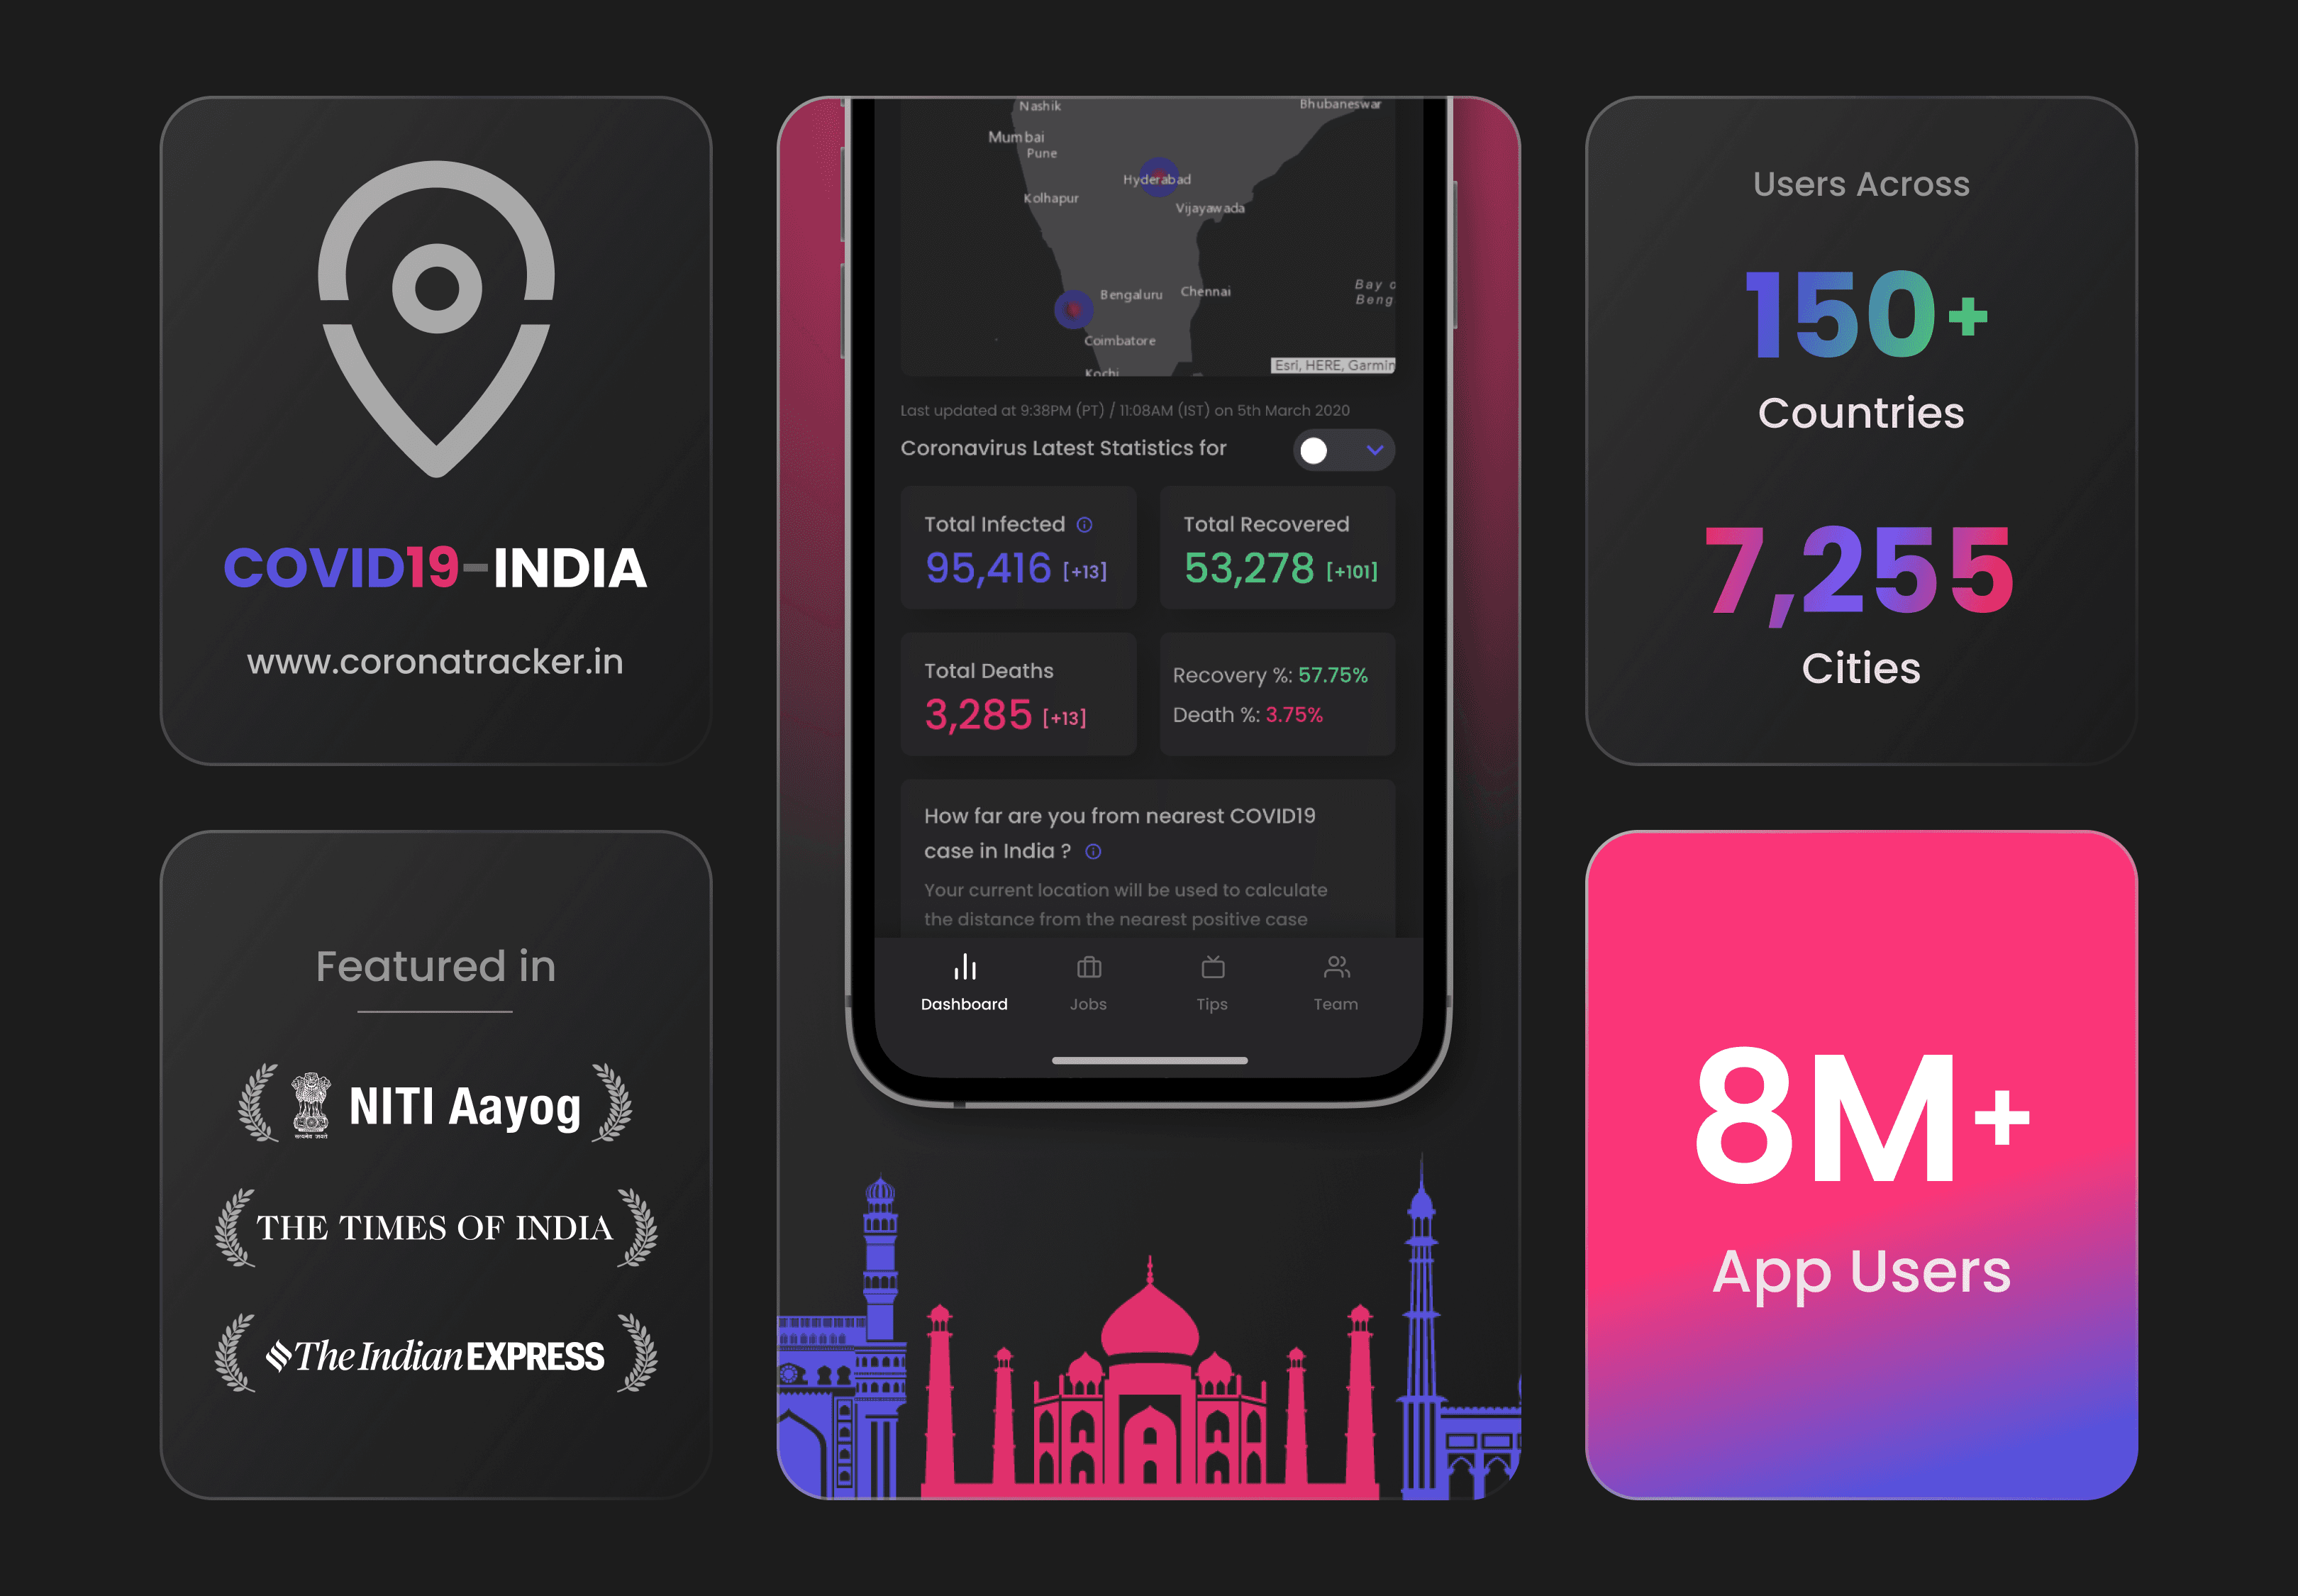
8M+ users on our progressive web app and Android app.
30M+ total page views and 19M+ total sessions, with 32% returning users.
Our users were spread across 7,255 cities and 150+ countries.
Reached an all-time high of 632k daily users and 50,850 real-time active users.
For the full stats and media coverage links, please visit the official website of the CoronaTracker, https://coronatracker.in.
These were some of our breakthrough stats:
Featured by NITI Aayog, Indian Express, Republic TV, and 20+ press releases by national and state-level news media.
Recognized and felicitated by the Chief Minister of Goa, Dr. Pramod Sawant.
8M+ users on our progressive web app and Android app.
30M+ total page views and 19M+ total sessions, with 32% returning users.
Our users were spread across 7,255 cities and 150+ countries.
Reached an all-time high of 632k daily users and 50,850 real-time active users.

Learnings
Prioritize speed as a strategic advantage. Seek support from volunteers, mentors, and industry leaders to expedite project launch. Rather than maintaining a consistently small team, consider expanding to get additional help for a quicker rollout.
Not every project requires monetization. Some initiatives should be approached altruistically. Despite substantial website traffic, we chose not to run ads, prioritizing a user-centric experience over monetary gains.
Continuously evolve your product. User needs are dynamic and evolve over time. Consistent research and communication with users are crucial to understanding their current preferences and adapting the product accordingly.
These insights serve as a valuable guide for future project developments.